CASPER: Improvements to Attendance Tracking
tl;dr
By adding three questions to an online form, we improve the accuracy and usefulness of student attendance tracking. I piloted it in one module during Spring 2024 and implemented it properly in two modules in Autumn 2024.
The problem
When I was an undergraduate, I would sign the names of friends on the paper attendance forms that were passed around. Periodically, I might ask them to do the same if I had a drastic emergency such as wanting to play a video game.
This tradition has continued to today and has survived the transition to digital: the official attendance for a random lecture in 23-24 was 181; I have never counted more than 50 humans in the room.
I require a new attendance tracking system that:
- takes less than 60 seconds for students to mark themselves ‘in’
- requires little additional work from me (once implemented: there can be a fair amount of work while I’m building it)
- secure: it should only track students actually in the lecture room
Most systems aren’t effective: signing in with Moodle is not fit for purpose, paper registers are a lot of work for me and don’t stop people signing friends in, and QR codes are fast and easy, but again, don’t stop the students sharing the link in group chats and so on.
My Solution
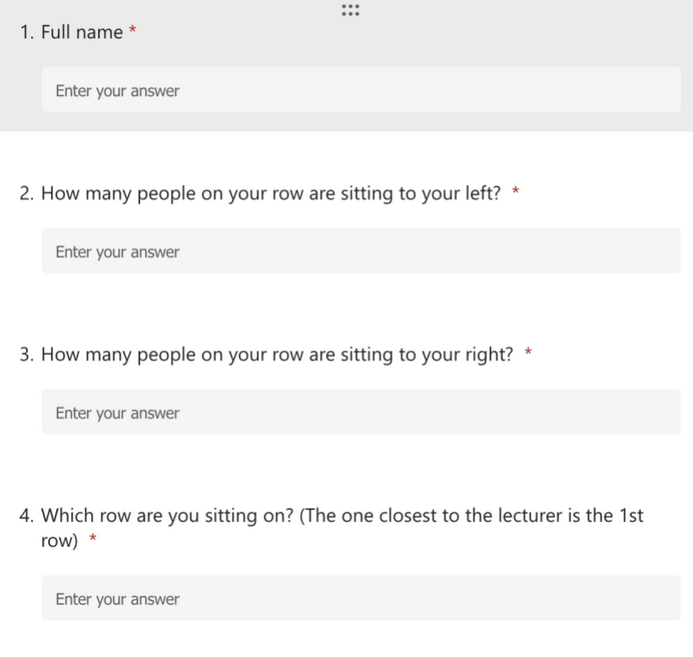
It turns out that we can solve almost all the security problems with a QR code by asking three additional questions:
- How many people are sitting to your left?
- How many people are sitting to your right?
- How many rows are in front of you?
Here’s a screenshot of the form I used:

These questions are easy and fast (students take an average of 58 seconds over the last 1,000 responses), and they give enough information for my code to produce a map of where each student is sitting.
This makes it easy to:
- Identify people who are in the lecture but forgot to sign in (because they appear in the counts of everybody else in the row)
- Identify people who aren’t in the lecture but have filled out the online form anyway (because a friend has sent them the QR code or link)
Let’s look at an example. Let’s say I have the following data for row 3:
| Name | 3 | Sitting Left | Sitting Right | Sum |
|---|---|---|---|---|
| Bluey | 3 | 0 | 10 | 10 |
| Bingo | 3 | 1 | 9 | 10 |
| Mackenzie | 3 | 8 | 2 | 10 |
| Bandit | 3 | 2 | 8 | 10 |
| Coco | 3 | 10 | 0 | 10 |
| Muffin | 3 | 4 | 6 | 10 |
| Peppa | 3 | 6 | 9 | 15 |
| Lucky | 3 | 6 | 4 | 10 |
| Rusty | 3 | 7 | 3 | 10 |
| Chilli | 3 | 3 | 7 | 10 |
| Chloe | 3 | 9 | 1 | 10 |
Ten students have filled in the form, and if I look up from my notes I would see ten students in the room.
However, Peppa has put in radically different numbers from the others and when I look up I probably won’t see her.
Now let’s look at the map:
| Seat 0 | Seat 1 | Seat 2 | Seat 3 | Seat 4 | Seat 5 | Seat 6 | Seat 7 | Seat 8 | Seat 9 | Seat 10 |
|---|---|---|---|---|---|---|---|---|---|---|
| Bluey | Bingo | Bandit | Chilli | Muffin | NOT FOUND | Lucky | Rusty | Mackenzie | Chloe | Coco |
There is a missing person between Muffin and Lucky! It turns out Socks forgot to fill out her form (in practice, it normally turns out that someone brought their partner to the lecture).¹
With these three simple questions, we completely fix accuracy problems in attendance tracking.
Proving a negative
Occasionally a student will claim they have been at every lecture but forgot to sign in (examples might be during disciplinary action, following a student complaint about quality of teaching, or during coursework feedback). With my system, students that have forgotten to sign in are immediately obvious (you can literally say “Mr Heeler, I don’t think you have signed in” after glancing at the map) and it’s possible to show for most lectures that there was nobody who forgot to sign in because the number of students on a row matches the total of the row.
Beneficial Effects
There are several beneficial effects:
- During the pilot, once the students understood the system of attendance, the number of students in the room increased from 45 at the start of the course to consistently 50 or above during February, making this a rare case of a module where the attendance increases during the term.⁰ During the more serious implementation I maintained a much higher (real) percentage of student attendance than other (spot-checked) lectures.
- The objective was to be able to find out which students were attending lectures so that I could tell (along with other sources of information) which groups of students were disengaging from the lectures. I was able to analyze the information and find several groups that I needed to contact, and I’ve put appropriate measures in place.
- It’s nice to contextualise emails from students: a regularly attending student might get a different response from a continually absent one (even if that’s “This is a short version of the answer, come and see me after the lecture if it is unclear”)
- The most useful feature is this: you can have a laptop open in the lecture that shows a complete map with the names of the students where they are sitting. Suddenly it’s much easier to say “Okay, I’ll take the question from Stripe, and then the one from Nana” or “Muffin, do you have something you need to share?”
Real Examples
This is an example of the mapping code running on a set of fake data.
How I run the session
In this example I showed the QR code for CASPER about 40 minutes² into a two-hour lecture, and go on with the lecture.
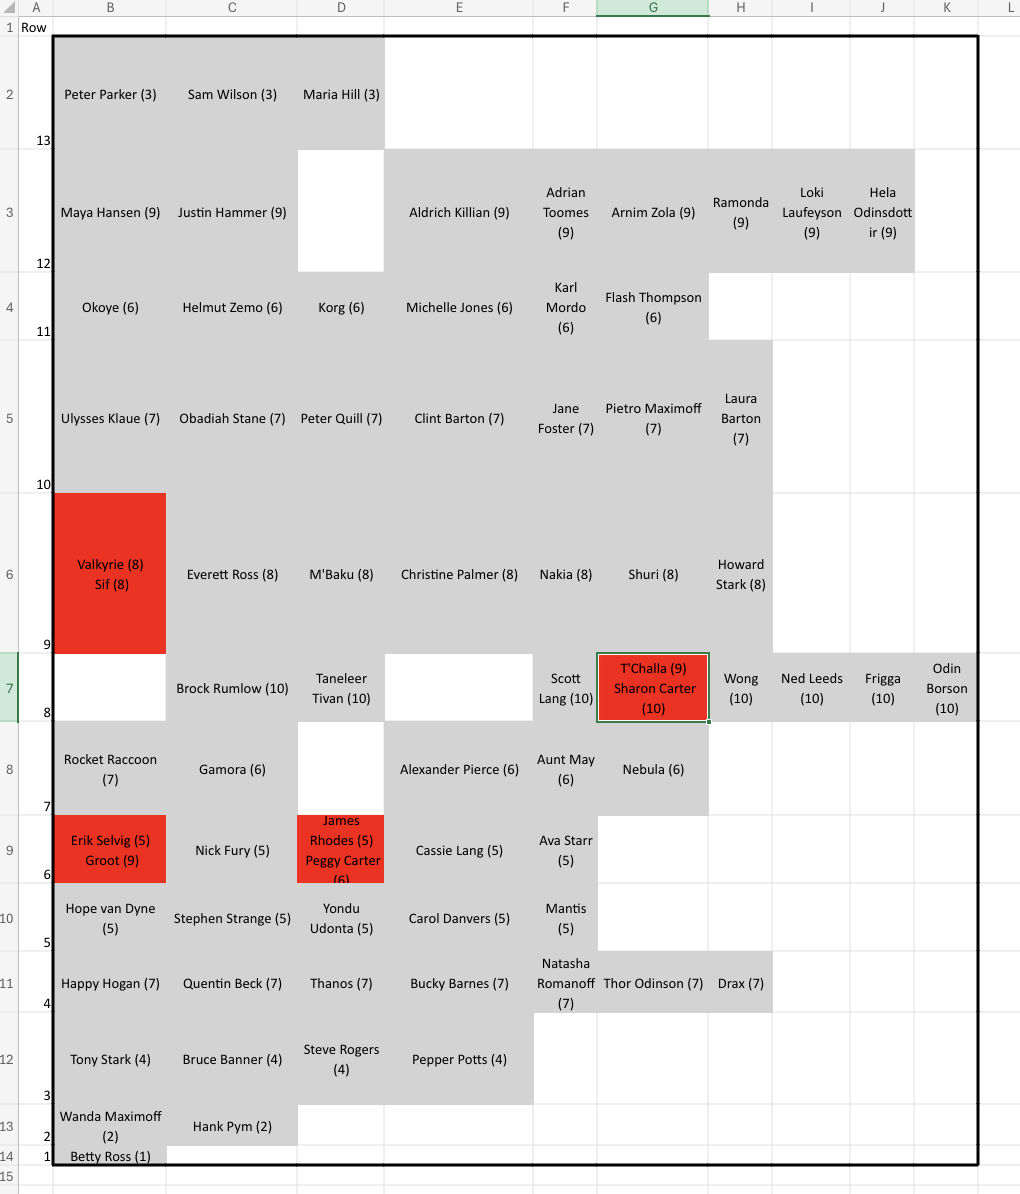
The next time the students had a small bit of thinking time I pressed the ‘go’ button on my laptop and got a map like this (this is a real map, but I have replaced all the student names):

(note that because the approach counts students rather than seats, the map shows everybody clumped up to one side)
With the map above I asked the following questions:
- Is Betty Ross here? (I could see the front row, and it was empty: Betty Ross wasn’t present)
- Is Happy Hogan here? (He had put himself in the wrong row; he is the missing person at the end of row eight)
- T’Challa and Sharon Carter where are you? Are you sitting on top of each other? (T’Challa had counted wrong, and should have been on the other side of Scott Lang)
- Justin Hammer - who is sitting to your left? (His friend was attending the lecture with them and didn’t think she should have filled out the form)
That took under two minutes minutes but it was clear to everybody in the room that:
- Everybody’s attendance was correctly recorded
- I can detect unexpected people
- I can detect errors or attacks quickly.
…and that sort of full review only needs to be done a once or twice before a culture is clearly established. This particular example was in the second lecture I gave, and future maps in both my and other lecture’s classes were extremely clean.
Future work
- I’d like to get the code to work on a proper sever so that the I could see the map being built up in real time as the students filled in their answers. That would tighten up the feedback loop considerably. I’d also like the interface with Moodle to be much more clean and automatic.
- The mapping code doesn’t properly account for late people - if someone arrives after everybody has counted then there should be a system to correctly insert them into the map.
Random Extra Tips
The current version of the Excel Script mapping code is in this Github repo
Acknowledgements
This work was made possible by guidance from Professor Peter Komisarczuk, my academic mentor, and Professor Adrian Johnstone, who provided a historical view. Angelina Bianchi provided wonderfully detailed answers to my queries, and the admin staff at EMPS put up with my continuing strange questions.
⁰ In a recent presentation I also claimed that the increase in attendance was due to me making my lectures very interactive so I probably need to get a bit more evidence for that…
¹ Worst. Date. Ever.
² As with all such attendance systems, it’s unwise to do them close to the start of the lecture.